Client: EvilAI Ltd|
Project: .greenworm — GHOST v1|
Label: EvilSignals|
Brief: A Pine interpreter that runs inside the order-flow terminal

Centreline
18%
52%
18%
67%
+
+
+
SIX STEPS · ONE HEAD · ONE EYE
45°
1 : 1
THE WORM CLIMBS AT UNITY
PLATE 03 · THE LANGUAGE
Your TradingView script, running beside the live book.
In one window.
TradingView gave you the language and showed you candles. The order-flow terminals showed you the book and gave you a settings dialog. Those were separate rooms for twenty years and you paid rent on both.
GHOST is a Pine interpreter with an editor docked under the chart. Paste an indicator, press RUN, it paints — on the same surface carrying the depth heatmap, the icebergs and the stacks.
It runs bar by bar exactly like Pine: var survives across bars, close[1] is the last bar, every call site keeps its own state. Arrays, user types, tables, labels, lines and boxes are all in. request.security resamples higher timeframes with no lookahead.
GHOST v1 · GHOSTSCRIPT v3
RUN
study("MA bands", true)
len = input(20, "Length", 2, 400)
mult = input(2, "Mult", 1, 5)
basis = sma(close, len)
dev = mult * stdev(close, len)
plot(basis, "Basis", "#FF4500", 1.5)
band(basis + dev, basis - dev, "Band", "#2563EB")
ok2 PLOTS · 0 SIGNALS · 2,021 BARS
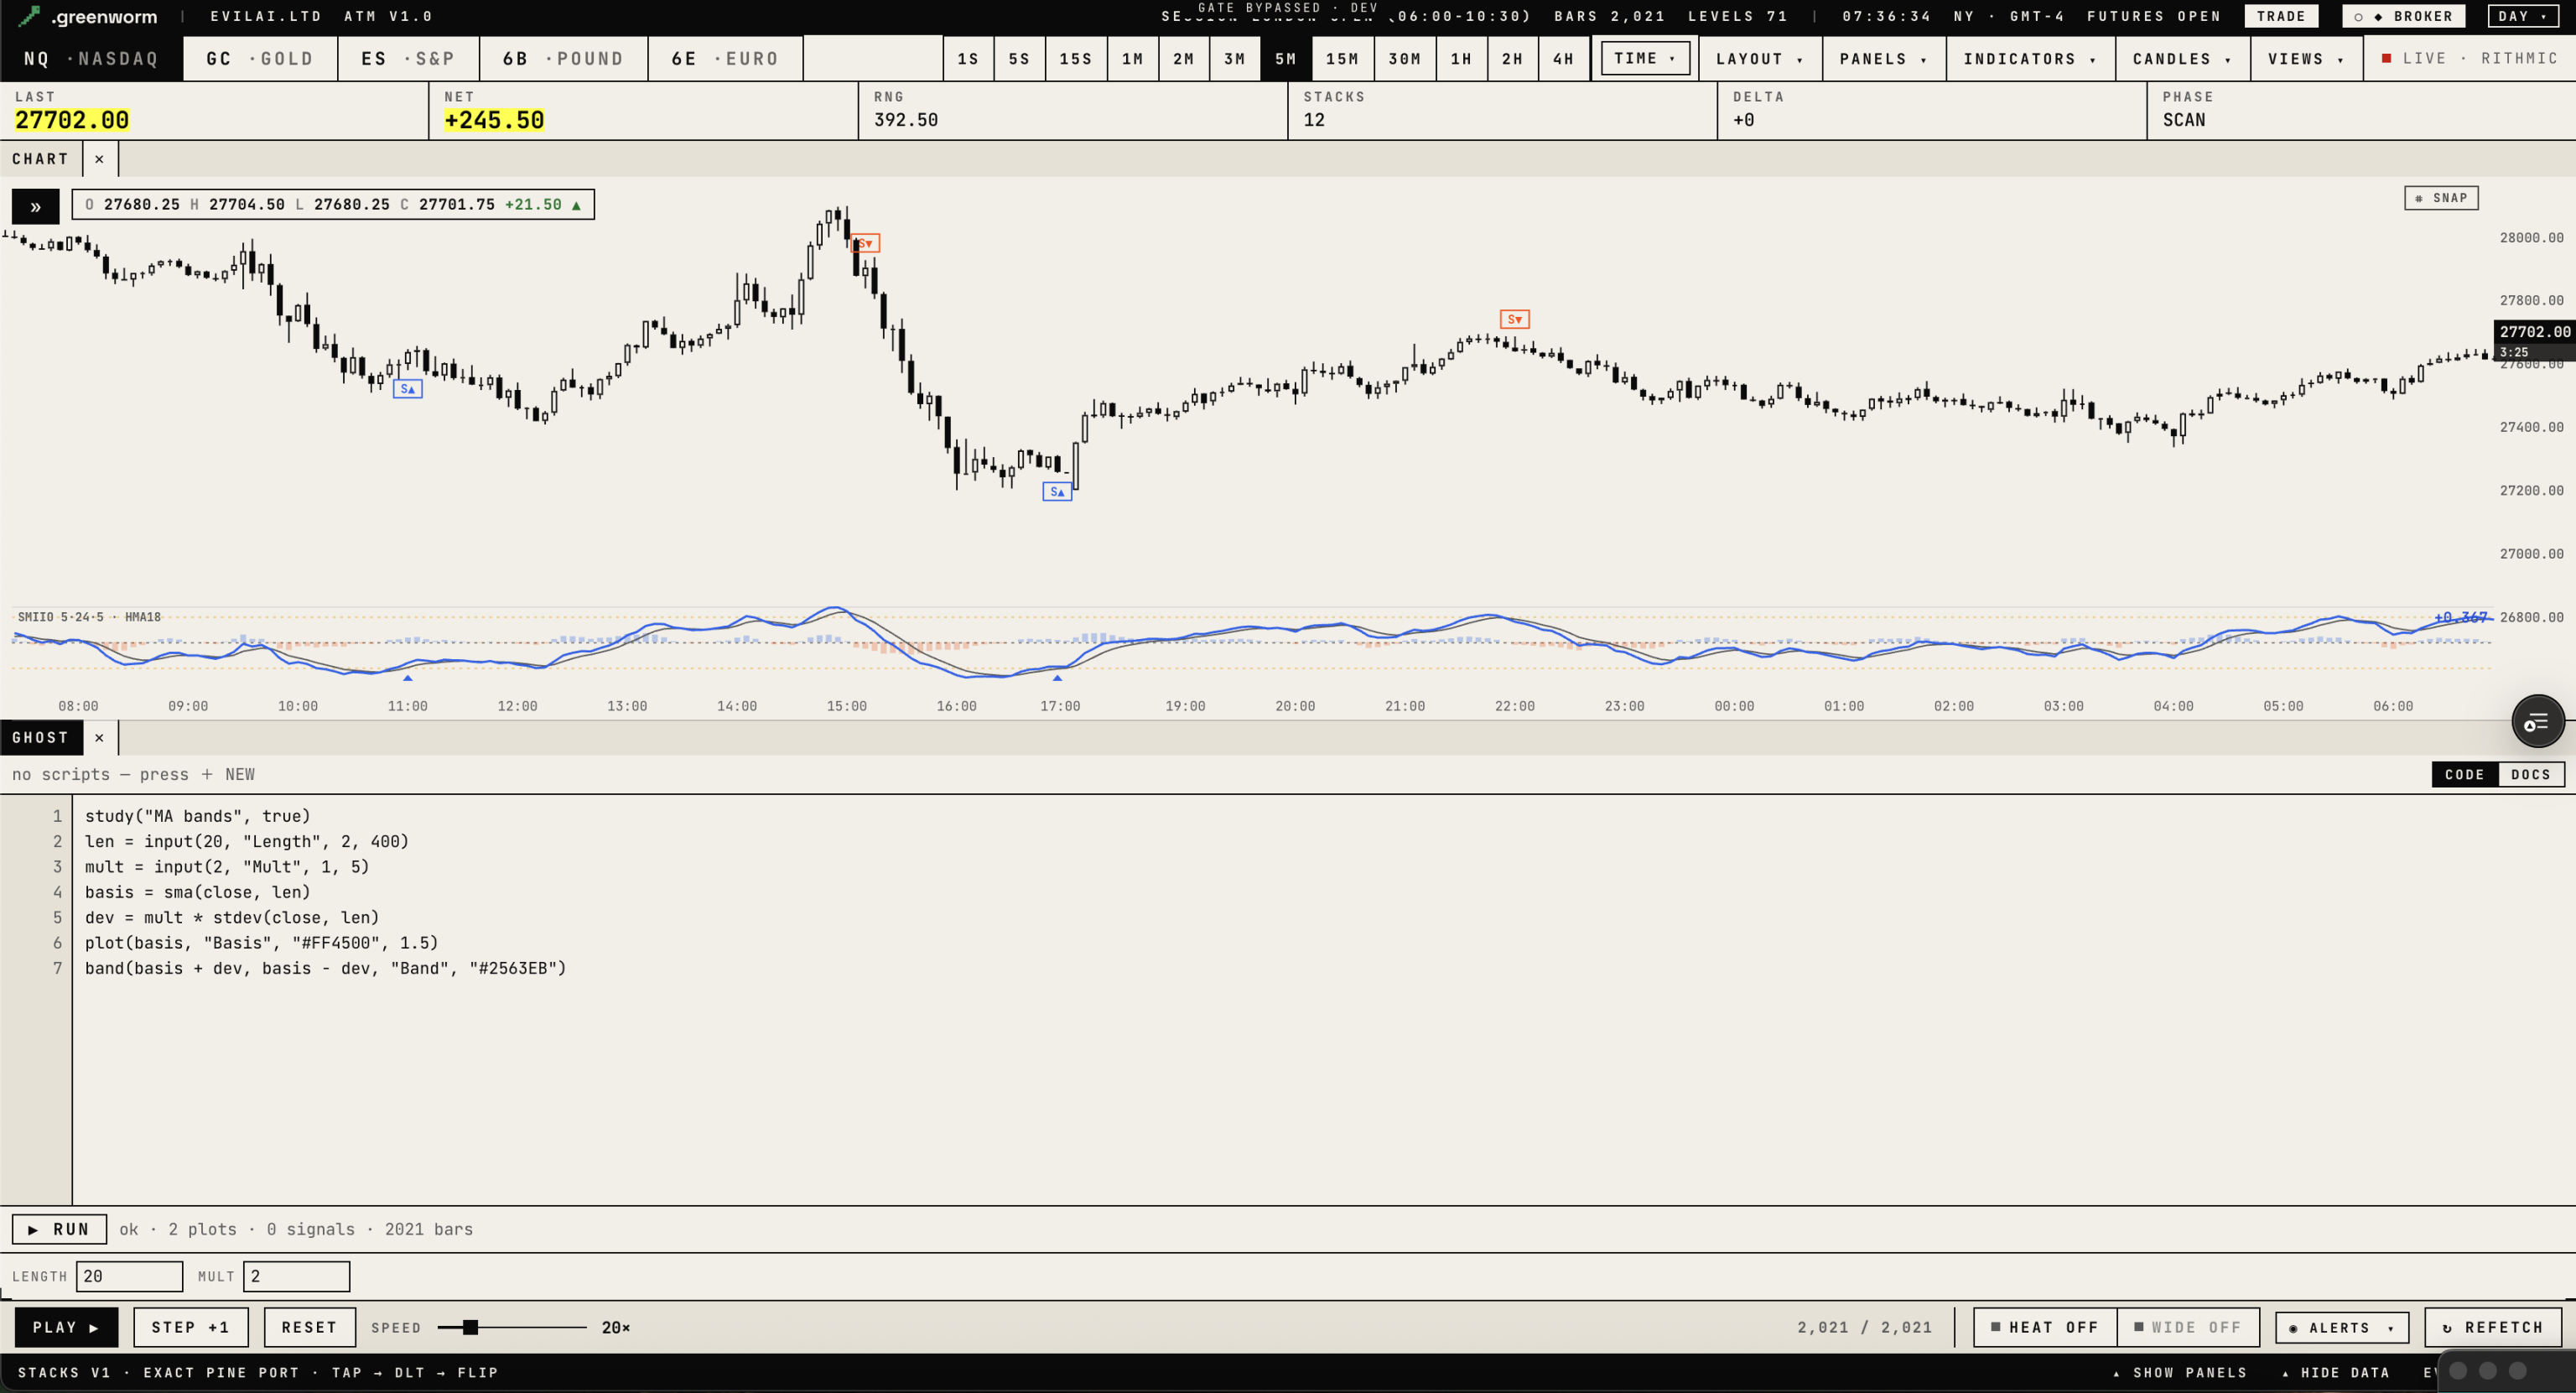
FIG. B · GHOST EDITOR DOCKED UNDER THE CHART · SEVEN LINES, TWO PLOTS, ONE OSCILLATOR STRIP
⌘/CTRL+ENTER RUNS
LANGUAGE
var / varip · := · if / else if / else · for · while · switch (both forms) · tuple destructuring · single- and multi-line functions · history [k] on any expression
TYPES
arrays with real reference semantics across bars · user types + Name.new() · typed declarations · label / line / box objects with set_*, get_* and delete · tables with nine anchors
OUTPUTS
plot · hist · band · fill · hline · plotshape / plotchar · barcolor paints the candles · bgcolor tints the ground · signal() drops a labelled long/short chip
SANDBOX
Closed interpreter. No network, no storage, no page access, a step budget and a four-second cap. The worst a bad script does is fail with a line number. The chart never freezes.
THE RULE
Scripts draw and they signal. They never place an order. That is the ticket's job, always.
BACKTESTS
strategy() runs against a broker emulator: next–bar fills, brackets, trailing exits, commission and slippage priced in dollars. Trades print as markers on the canvas and the Strategy Tester reports net profit, max drawdown, win rate, profit factor, the expectancy curve and monthly and hourly breakdowns. It is a simulation — the script still never reaches the live ticket. request.financial is the one call that resolves to na, and the log says why.
Contents: .greenworm — Charting & Order Flow V1
GW–01FIG 1 · HEAT
FIG 2 · STACKS
FIG 3 · TICKET
HEAT
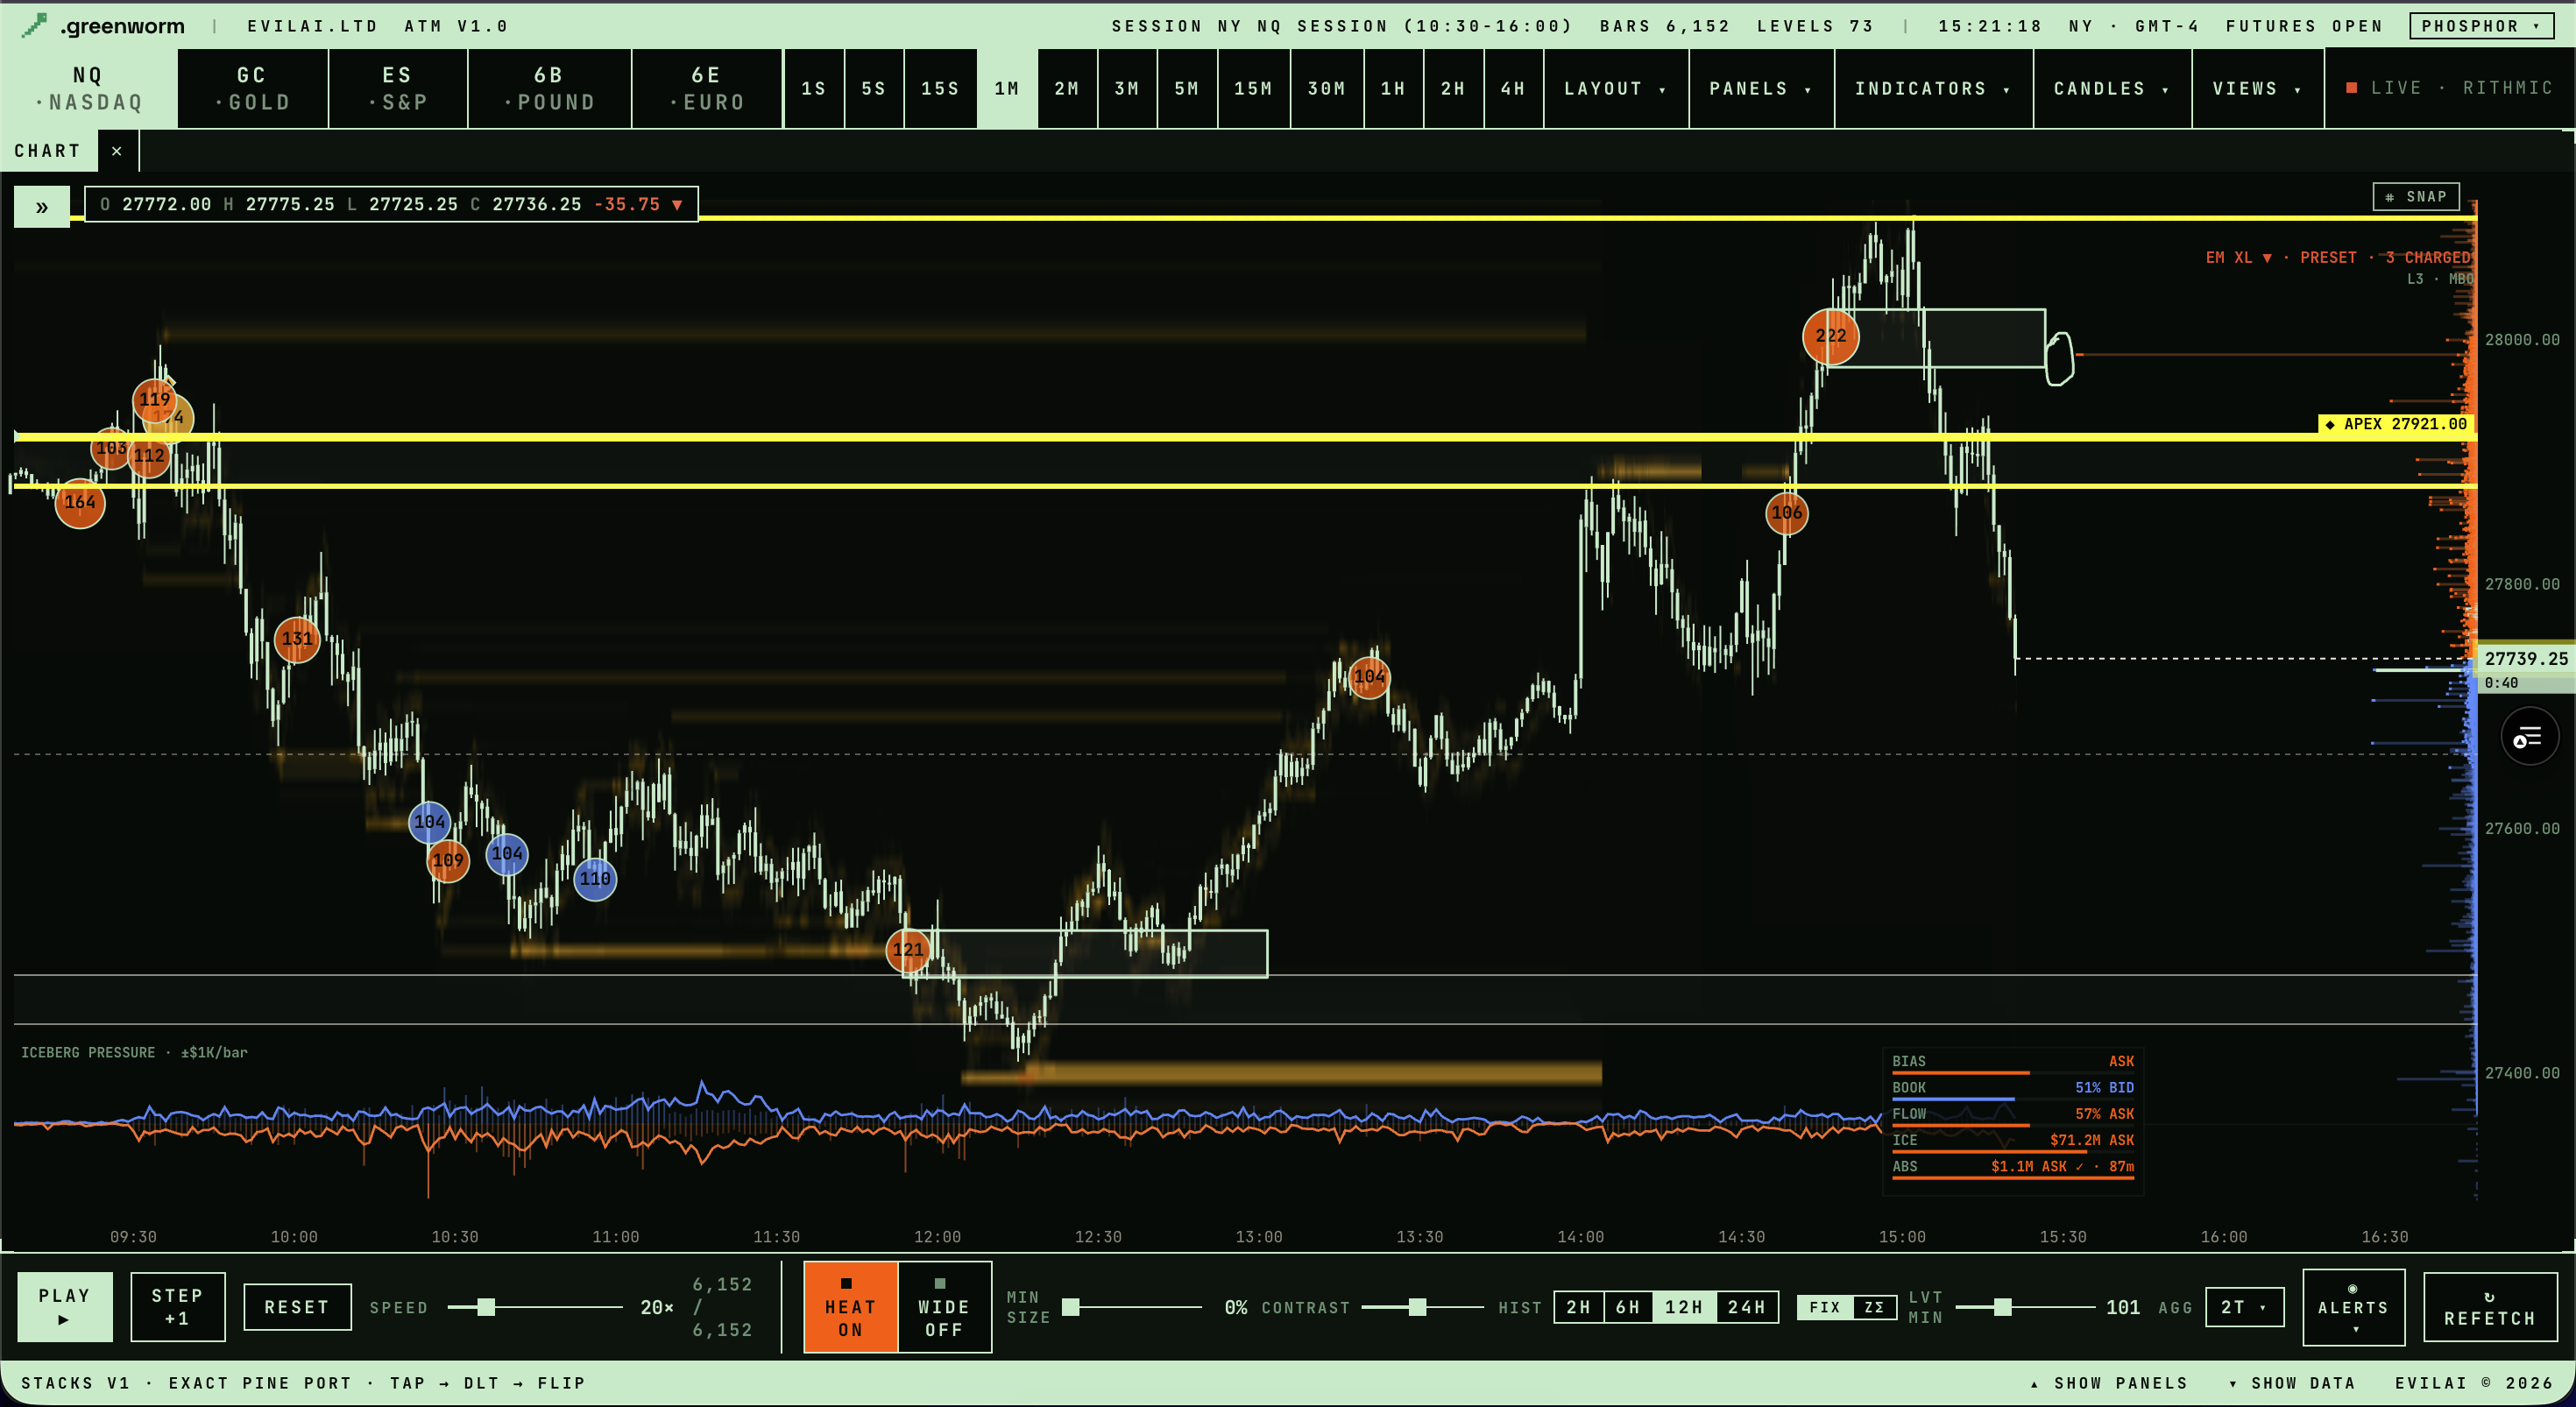
Full-depth liquidity heatmap with 24 hours of book behind it — step back 2H, 6H, 12H, 24H. Iceberg bubbles sized by refill, absorption trace, five ramps, min-size and contrast filters, and WIDE to reach the walls parked off-screen.
24H OF BOOK
STACKS
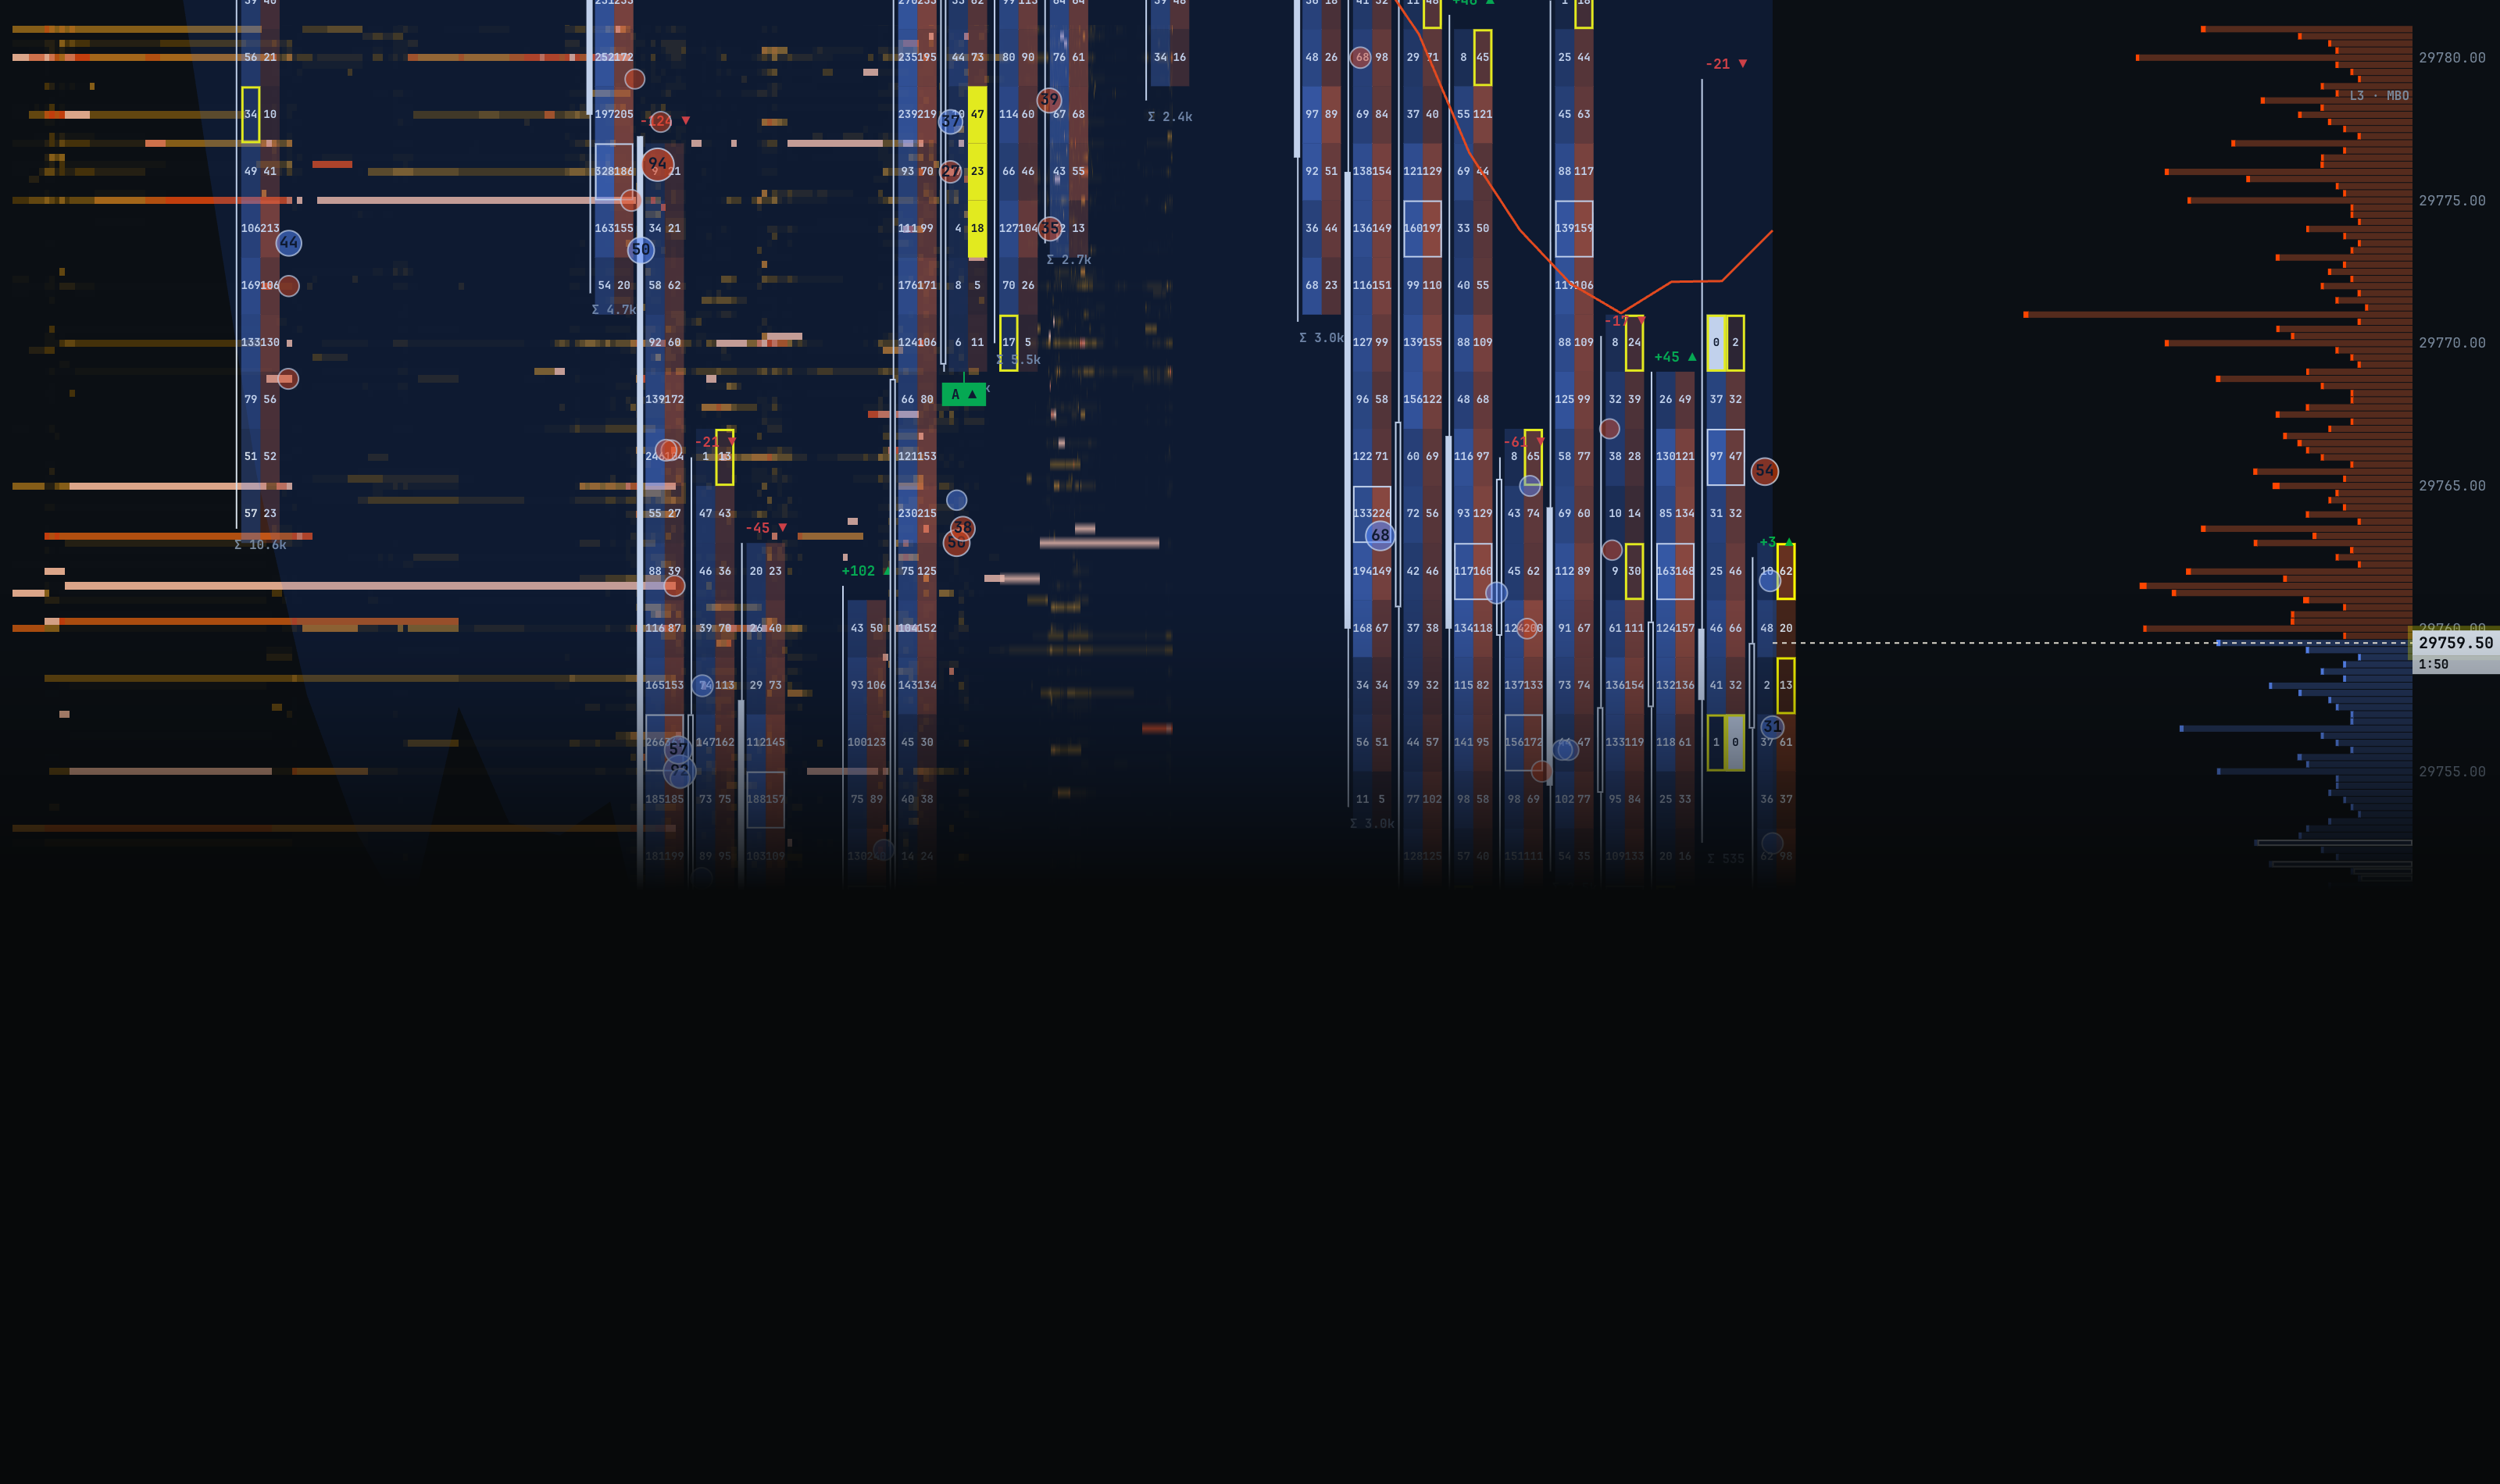
The Stacks indicator as an exact Pine port, computed from market-by-order rather than aggregated prints. Footprint candles carry per-price bid×ask ladders, measured delta, Σ volume and stacked imbalances. NQ and GC today.
NQ · GC
LEVELS
EM Levels XL lays an auto-ranged grid across the session and marks the levels carrying a charge, the one that matters most, and the moment price is sent to raid them. Alongside it: TPO with value area and structure marks, session volume profile, deep profile swing, Monday range, anchored VWAP, sessions, zones, LVT and open interest.
AUTO–RANGED
GHOST
GhostScript v3 — a Pine interpreter with an editor docked under the chart. Paste the indicator you already run, press RUN, and it plots, tints, paints bars and fires chips exactly as it always did. Arrays, user types, tables and higher-timeframe requests included.
GHOSTSCRIPT v3
TICKET
Broker-attached execution against your own login. Market, limit, stop, stop–limit and passive joins that rest at the touch. Micro sizing off the major-contract chart, auto-bracket, drag the stop and target on the price axis, break–even, reverse and flatten per position, cancel every resting order at once, and a continuous reconcile against the broker. TopStepX and Tradovate.
TOPSTEPX · TRADOVATE
SIM
An in-house paper broker that fills at the live touch and nets like a real futures account. Same ticket, same order types and same netting rules as LIVE — set your own balance, wipe it whenever. No broker, no sign-in.
$50,000 · RESETTABLE
REPLAY
Rewind the session and walk it forward at up to 20×, or one bar at a time, with the depth and the levels moving as they moved. Every chart in the terminal is a replay chart.
STEP +1
MOTHERBRAIN
The layer above the tools. Depth, levels, icebergs, absorption, streak, the tape, footprint delta and imbalance, intraday open interest: all of it reports into one engine, which reads them against each other instead of showing you each in turn. When they line up it tells you, and it can put a pop–up on screen and draw the alignment on the chart where it happened. Your screen stays quiet and you still catch it.
ALL SYSTEMS IN
JOURNAL
Round trips land here as they close, each with an R multiple measured against the stop you actually entered with. Win rate, gross, fees, net and expectancy across the set. Write down what you saw; export the lot as CSV with the notes attached.
R MULTIPLES · CSV
WATCH
Every instrument on one list with its live spread, session move and open–interest change. Open a row for session high and low, the exchange settlement with its contract and date, and how far our close sits from it. Click to chart it.
OI · SETTLEMENT
SIGNALS
Stacks fired by this terminal, and your EvilSignals marks mirrored in from the app — both on the same surface as the flow that caused them. Price alerts arrive as a Discord DM with the terminal closed.
EVILSIGNALS · INCLUDED
31001 · Barcode: 643443100120
CHARTS NQ · GC · ES · 6B · 6E
EXEC MNQ · MES · MGC · M6B · M6E · M2K · MYM · MCL
L3 MBO · RITHMIC — ORDERS · TOPSTEPX · TRADOVATE
EVILAI LTD · NOTHING HERE IS FINANCIAL ADVICE
EXEC MNQ · MES · MGC · M6B · M6E · M2K · MYM · MCL
L3 MBO · RITHMIC — ORDERS · TOPSTEPX · TRADOVATE
EVILAI LTD · NOTHING HERE IS FINANCIAL ADVICE
PLATE 05 · INSTRUMENT PANEL · WHAT IS ACTUALLY ON BOARD
CHARTING & ORDER FLOW V1
14
TIMEFRAMES
1s · 5s · 15s · 1m · 2m · 3m · 5m · 15m · 30m · 1h · 2h · 4h · 1d · 1w. Seconds charts on the same tape as the weeks.
8
BAR MATH RULES
TIME · TRADES · VOLUME · RANGE · REVERSAL · IMBAL · P&F · DELTA. Seven of them close a bar on activity, not on the clock.
19
INDICATORS ON THE SHELF
Sorted into six searchable groups and all named in the directory below. Nine are proprietary to this terminal. The rest are the classics, computed off market-by-order.
6
CANDLE MODES
Candles · Heikin-Ashi · Hollow · Bars · Line · Footprint, with favourites pinned to the front. The footprint is the same object, opened up.
9
CHART LAYOUTS
Single, 2 columns, 2 rows, 1+2, 3 columns, 3 rows, 4 grid, 4 columns, 4 rows. Panels dock, drag and resize; the layout survives the restart.
16
THEMES
Day, Night, Obsidian, Graphite, Phosphor, Oxblood, Sepia, Arctic and eight more. Grounds only — flow colours are identical in every one.
16
DRAWING TOOLS
Trendline, ray, extended line, arrow, horizontals, vertical, rectangle, fib, brush, text and a measure that reads Δprice, Δ%, bars and time. Magnet on. Global or this pane only.
20×
REPLAY SPEED
Play, step one bar, reset to the live edge. Space plays, full stop steps, R returns you to now — and ⌘K opens a palette that searches the whole terminal.
DIRECTORY · EVERY TOOL ON THE INSTRUMENT
GW–01 · PARTS LIST
PANELS
DOM ladder · Trade ticket · Time & Sales · Orderflow · Streak · Cluster search · Signals · Alerts · News · Resting age · Watchlist · Journal · Ghost editor · Strategy tester · Wormchat · MOTHERBRAIN. Every one docks, drags, resizes and tears off; the ticket floats and minimises. RESET LAYOUT puts it all back.
15 PANELS
INDICATORS
Order flow — LVT, Orderflow Marks, CVD, Δ Volume, Open Interest, Iceberg Pressure, EvilAI Icebergs, Deep Profile Swing. Volume & profile — Volume, Session Volume Profile, TPO. Levels & zones — Stacks, Key Levels, Transients, Snapread, EM Levels XL, Range Fuel, Trend Magnitude, MMLVM, Gamma and GEX Levels, Zones, Sessions, Monday Range, L2 Book, L3 Book, Order Book Profile. Entry models — Fair Value Gaps, Order Blocks, Auto OTE, CISD. Standard — RSI, MACD, Stochastic, ATR, Bollinger Bands. Averages & oscillators — VWAP and anchored VWAP — right-click a candle to drop the anchor and drag the pin anywhere in history — Moving Averages, WeeYamOsc.v1, htfOSC. Bar paint — TrendBars v1, Exhaust Bars v1. Signals — Lab Signals β. Context — News, period candles. Type to find any of them.
41 · 9 GROUPS
CANDLE TYPES
Candles · Heikin-Ashi · Hollow · Bars · Line · Footprint. Switch mid-session; the flow layers stay where they were.
6 MODES
FOOTPRINT
Per-price bid×ask ladders inside every bar, one row a tick or clustered by ticks-per-row. Bid on the left, ask on the right; the diagonal is compared at your own ratio, 200% by default, and consecutive imbalances collapse into a ◆ with the run count on it. VAH, VAL and the POC row are marked inside the bar, and the block underneath carries delta, Σ volume and net trade count. Classic numbers or the quieter current look, tint or bar-length cells, ask on the left if you read it that way, and a filter that hides the thin rows. The iceberg read comes in several generations and you choose which one paints — the one that opens the bar up, the one that lays levels across the session, or the one that reproduces the original script dot for dot.
PER–PRICE LADDERS
TAPE
LVT prints the big trades as bubbles sized by contracts — blue took the ask, orange hit the bid, and a gold ◆ is absorption: size arrives, passive limits eat it, price holds inside three ticks for the next few seconds. A threshold slider drops the small ones and an aggregation tier decides how near two prints must be to merge, exact through one, two and four ticks to a whole bar. The newest bubbles settle a beat behind live, because absorption cannot be known until the follow-through happens. Underneath: CVD as a line or its own candles with session resets, a Δ volume histogram a bar, and Iceberg Pressure scoring the hidden passive fills on a compressed scale you read against itself, not in lots.
LVT · CVD · ICE
ORDER BOOK
Four ways to read resting liquidity. The ladder prints size and order count a side — 184 (31) is 184 contracts across 31 separate orders — with ΣBID and ΣASK running totals, the spread and live imbalance. HEAT tracks how the book changes over time, a column a moment, with contrast, a min-size filter, WIDE to reach the walls parked off-screen and a lens that reads exact size. L2 draws depth bars beside the axis; L3 goes down to the individual order. The book profile builds the last 30 minutes into zones and runs leader lines to the ones that matter. RESTING AGE watches fatigue — how long a block has sat without being pulled or filled.
4 VIEWS
PROFILES
A session volume profile with VAH, POC and VAL on the edge, or a classic TPO market profile — one letter per 30-minute bracket, initial balance off the first two, single-print tails, poor highs and poor lows. Sessions cut on New York time: Asia 18–03, London 03–09:30, NY 09:30–16, close 16–18. Deep Profile Swing draws one for every swing leg and keeps the live leg updating as it forms. Fixed Range is a drawing tool — click two points, get the profile for exactly that window.
VAH · POC · VAL
BAR MATH
TIME · TICK · TRADES · VOLUME · RANGE · REVERSAL · DELTA · IMBAL · P&F. TIME is the clock chart you know. The other eight close a bar when the market does something, not when the minute is up — and they run on the same server-side data, so a quiet hour and a violent one print the same way.
9 RULES
SIGNALS PANEL
LOCAL STACKS — every stack this terminal fired, with its level and target. MY SIGNALS — your EvilSignals marks mirrored in from the app. Click any row and the chart jumps to it. Underneath: finalised stats by direction, FAV/ADV and TP1 win rate, live.
LOCAL + PWA
TRADE EXECUTION
SIM or LIVE from the same ticket. Market, limit, stop, stop–limit, and passive joins that rest at the touch and let the broker price them. Quantity presets, auto–bracket, or type the stop and target and drag them on the price axis. Right-click the canvas above or below price to rest a limit or a stop at that level, and drag a resting order to re–price it — the confirm shows the old value and the new one. Drag a stop or target leg to move the bracket. In SIM the DOM takes a click on any row to rest, and a click on your own label to pull it. Per position: trail at a fixed tick distance, break–even, reverse, flatten — plus flatten–everything, cancel–every–resting, and an exit that clears the resting orders before it closes you out. Micro sizing off the major-contract chart (chart NQ → exec MNQ, $2/pt).
TOPSTEPX · TRADOVATE
EXECUTION SAFETY
A LIVE entry without a stop is refused, and refused at the server, so it holds whether or not the button in front of you is behaving. Positions are continuously reconciled against the broker, and anything the broker will not confirm is flagged rather than quietly displayed. Prices are re–snapped to the instrument’s tick before an order leaves. Entries net like a real futures account: same side adds, opposite side reduces, closes, flips.
SERVER–SIDE
SIM ACCOUNT
An in-house paper broker. Fills at the live touch, brackets simulated client-side, balance is yours to set and wipe. No broker link, no sign-in, same ticket and same netting rules as LIVE.
$50,000 DEFAULT
DRAWING
Over sixty tools on a rail down the left of every pane, in six flyout groups with their own keybinds: lines and rays, shapes, fibs, measures, annotation and markup. Measure reads Δprice, Δ%, bars and time. Magnet on or off. Markup goes global or stays in the pane you drew it in.
60+ TOOLS
THEMES
Sixteen looks from the masthead — Light, Night, Phosphor, Graphite, Obsidian, Oxblood and the rest. The structure never moves and neither do the flow colours: blue is buy-side aggression, orange is sell-side, gold is absorption, yellow is a live imbalance. A screenshot reads the same whichever skin you run. Build your own in the theme editor and export it as a string.
16 LOOKS
TIMEFRAMES
1S to 1W off the quick row, or build any custom interval you like. Daily and weekly bars align to CME trading days and the Sunday evening open — not to an arbitrary midnight.
1S → 1W
SESSION MEMORY
Indicators, themes, layouts, drawings and alerts save to the account, so the desk at home and the laptop on the road open identical. A hard reload will not sign you out.
FOLLOWS YOU
KEYBOARD
Press ? anywhere for the sheet it all comes from. 1–9 jump timeframes. ⇧V, ⇧L, ⇧O, ⇧C, ⇧W, ⇧S and ⇧H toggle volume, LVT, TPO, CVD, VWAP, sessions and the heatmap; ⇧T opens the tape; ⇧F drops to canvas only. Letters arm the drawing tools straight from the keyboard, ⌘Z and ⇧⌘Z walk the markup back and forward, ⌘S folds the tab into its layout. ⌘K opens a palette that searches every action by name.
? FOR THE SHEET
REPLAY
PLAY, STEP +1, RESET, speed to 20×. Scrub the bar you want or step one at a time; Space plays, full stop steps, R returns you to the live edge. Every indicator, level and flow signal recomputes from what was known at that second — the screen is the screen that existed on the day, with no future leaking back into it.
EVERY CHART
VIEWS
Save the whole view as a preset, copy it as a code, paste someone else’s and their panes, symbols, indicators and zoom land on your screen.
VIEW CODES
ALERTS
Set one where you would draw a line: right-click the canvas, or arm it from the watchlist. Drag an alert to move it, drag it off the chart to delete it. The condition can be a price, an indicator state, a Pine or Ghost script, or a level interaction — fire only when price tests a high-power stack. They arrive as a Discord DM from the alerts bot, and the relay catches them with the tab shut. Fired alerts keep a log with a JUMP that snaps the chart back to the second it triggered.
DISCORD DM
DATA & CUSTODY
Live L3 market-by-order from Rithmic. Charts on NQ, GC, ES, 6B, 6E; execution on the micros. Your broker API key transits once, is exchanged for a token and discarded — never stored, always your own login, never a shared account.
TOKEN-ONLY
MOTHERBRAIN
The consolidation engine, and the reason you do not need all nineteen indicators on screen at once. Every system reports in: depth, levels, icebergs, absorption, streak, footprint delta and imbalance, large trades, intraday open interest. MOTHERBRAIN reads them against one another and looks for the agreements a human spots late and a single indicator cannot see at all. What comes back tells you what has lined up, at what price, and which way it leans. Take it as a pop–up, as an illustration drawn on the chart where it happened, or as neither and read it when you look. Tolerances are tuned per instrument, because a tick means something different on gold than it does on the Nasdaq.
ALL SYSTEMS IN
JOURNAL
Round trips arrive as they close, each with an R multiple against the stop you actually entered with, not one picked once you knew the answer. Trades, win rate, gross, fees, net and expectancy across the set, your own fee schedule, a note per trade, and CSV export with the notes attached.
EXPECTANCY
WORMCHAT
A cut-down build of our own messaging app, dropped into a panel so the room sits beside the chart instead of in another window. One room, no channels, no calls — the part you actually want open while the tape is running. Enter sends, ⇧↵ breaks a line, and a notification sound tells you something landed while you were reading the tape. It stays readable signed out — you can watch the room before you have an account.
READS SIGNED OUT
WATCHLIST
Every instrument on one list: live last, session move measured from the session open, not the prior close, the current spread, and the day’s open–interest change. Open a row for session high and low, the exchange settlement with its contract and date, and how far our close sits from it. Click to chart it.
OI · SETTLEMENT
THE DAILY NUMBERS
Open interest and settlement come off the exchange after the session and are revised the next morning, so the terminal labels them FINAL with their as–of date and says outright that they are not live. Settlement is separately computed from the last trade, which is why a daily candle can sit a few ticks off it. The terminal shows you both rather than picking one.
DAILY · REVISED
COLOUR IS FUNCTIONAL
IT DOES NOT MOVE WITH THE THEME
BLUE
Buy-side aggression — market orders lifting the ask.
ORANGE
Sell-side aggression — orders hitting the bid, and any armed tool.
GOLD
A large order being absorbed at the level.
YELLOW
Selection, and a live volume imbalance.
Sixteen themes change the ground and nothing else. A screenshot of the flow reads the same whichever one you run.
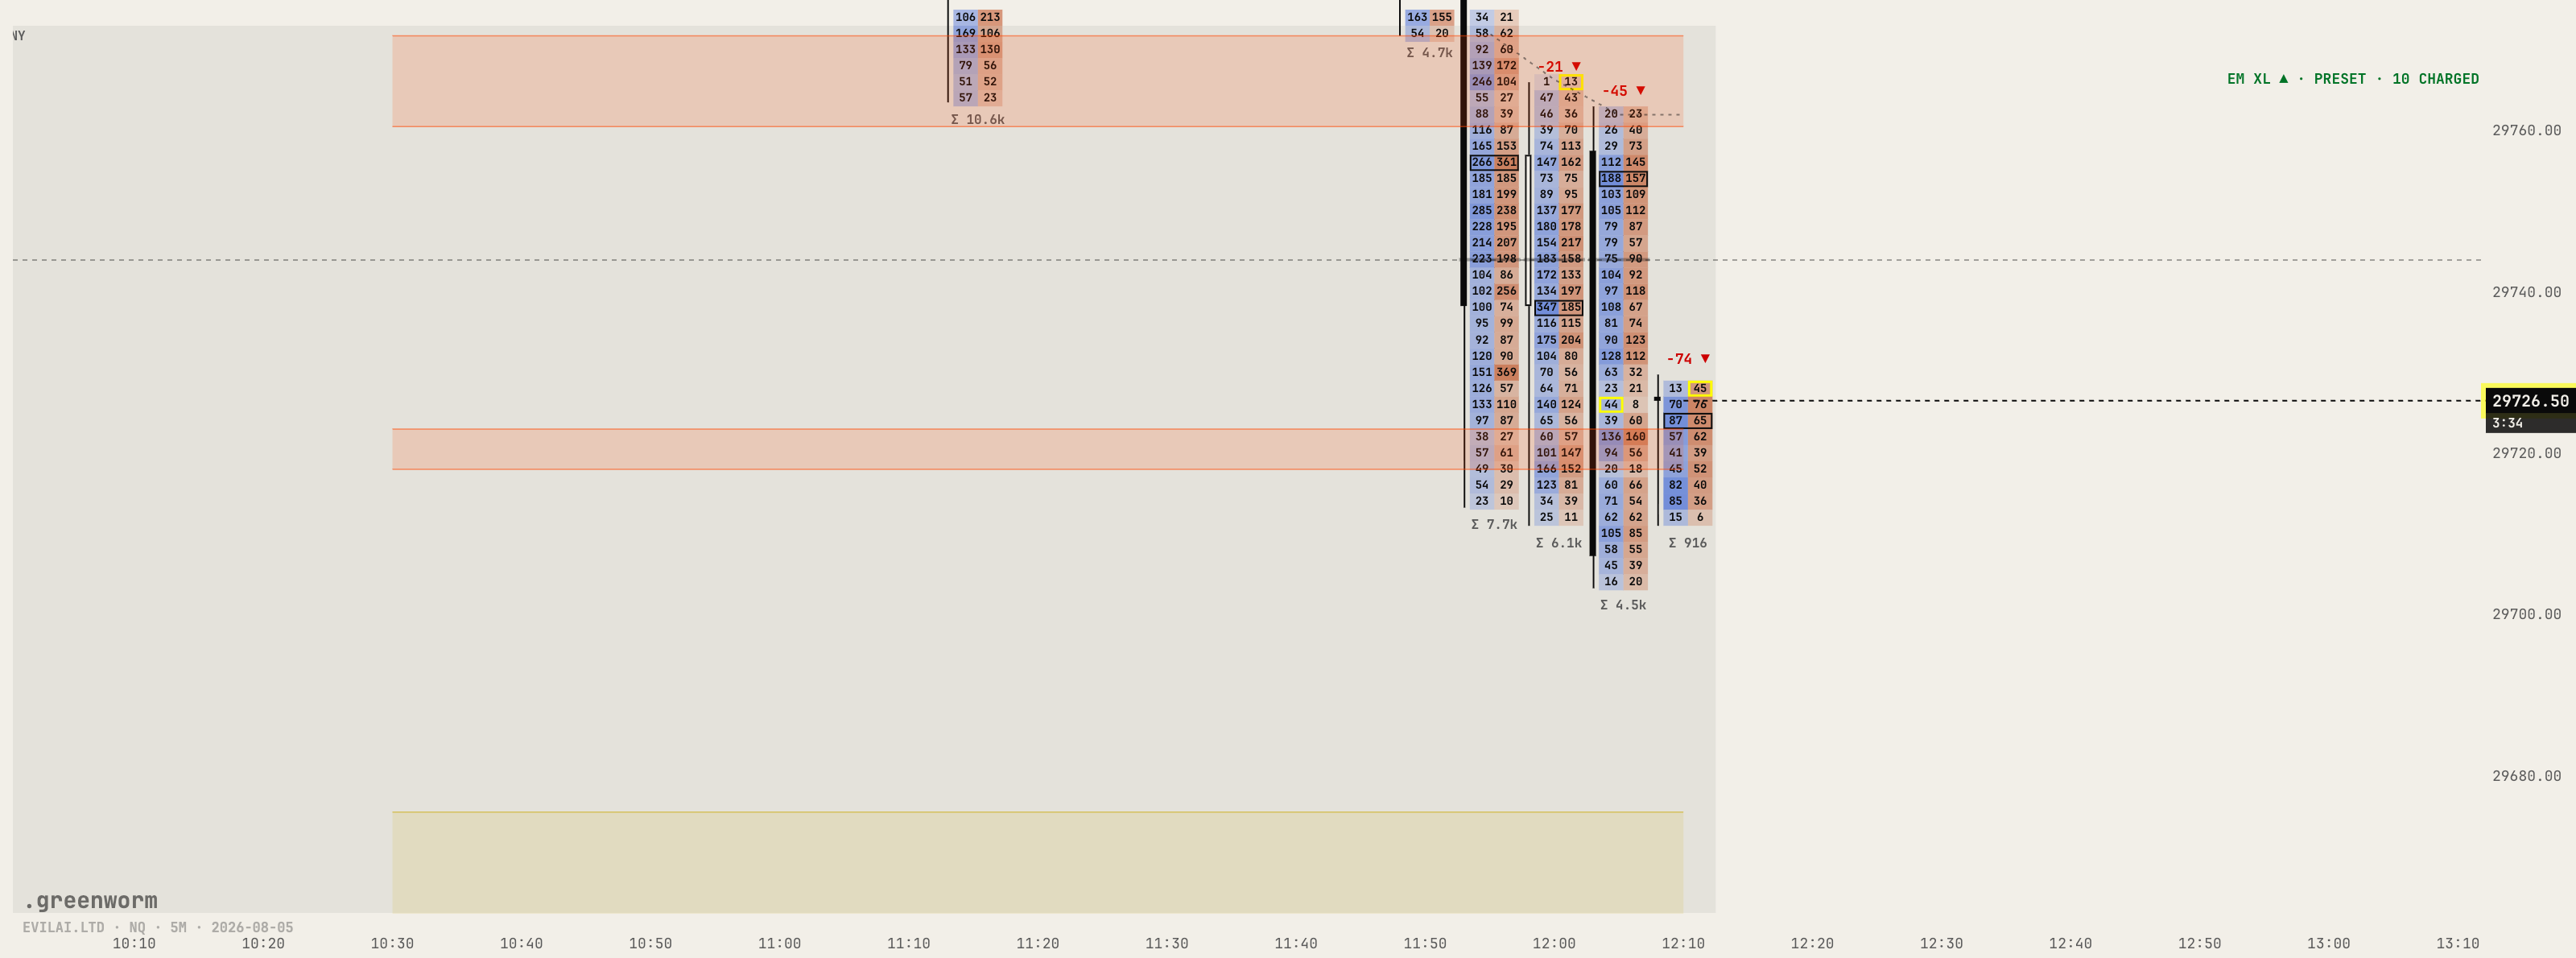
PLATE 06 · THE TERMINAL
If you pay for either, you already have it.
The terminal is live and it is part of the suite. An EvilAI Premium subscription and ATM Lab access both carry the CHARTS role; the terminal reads it at sign-in and stands aside. There is no separate purchase, no licence file, no serial and no waiting list — if you hold either, it is already yours.
Sign in with Discord. The role is the key, and Discord is what carries it, so there is nothing to enter and nothing to lose. Your indicators, themes, layouts, drawings and alerts save to that account, which is why the desk at home and the laptop on the road open identical. Not subscribed to either? EvilAI Premium and ATM Lab are the two doors in.
INSTRUMENTS
5
BAR MATH
9
DRAWING TOOLS
60+
GW–01 · LAUNCH
OPEN
Sign in with Discord and the terminal reads your role. On Chrome or Edge, hit Install for a clean windowed app; on Safari 17+, Add to Dock. Updates install themselves the moment we push them.
OPEN THE TERMINAL
Neither subscription yet? The terminal comes with EvilAI Premium or ATM Lab — either one opens it.
BUILT FOR A DESKTOP MONITOR · FITS A 1280×800 LAPTOP
WATCHLISTS AND ALERTS WORK ON A PHONE
WATCHLISTS AND ALERTS WORK ON A PHONE
NO LICENCE FILE. NO SERIAL. THE ROLE IS THE KEY.
.greenwormEVILAI LTDEVILMODEL.COMINSTRUMENT GW–01NOTHING HERE IS FINANCIAL ADVICE© 2026